
The development of 300 Ivy and 388 Fulton continues the reparation of the neighborhood damage caused by the collapse and removal of the Central Freeway.
One of DBA’s proudest achievements of 2016 is the launch of a new firm-wide Sustainability Action Plan. The Action Plan is our response to the AIA 2030 Commitment, which we signed in 2015. Signing the Commitment gave us the chance to step back from decades of work supporting high performance urban housing and initiate more focused discussion among our staff about what sustainability means to us, what we do well, and how we want to push our practice forward.
Signing the 2030 Commitment marks a shift for DBA—as it has for hundreds of firms preceding us—from a paradigm in which “sustainability” is evaluated project-by-project in terms of discrete performance measures to one that looks at performance comparatively, across our entire portfolio.
The metric typically used for benchmarking buildings is energy use intensity (EUI), which is the total amount of energy used by the building (on site) over a typical year, divided by the building’s gross square footage, excluding any structured parking. Benchmarking and reporting for the 2030 Commitment entails evaluating how the EUI predicted for each building compares to the “baseline” for that building type (as established by national data collected around 2003). Every five years the percent reduction you have to reach increases as we all work towards carbon-neutral portfolios by 2030.
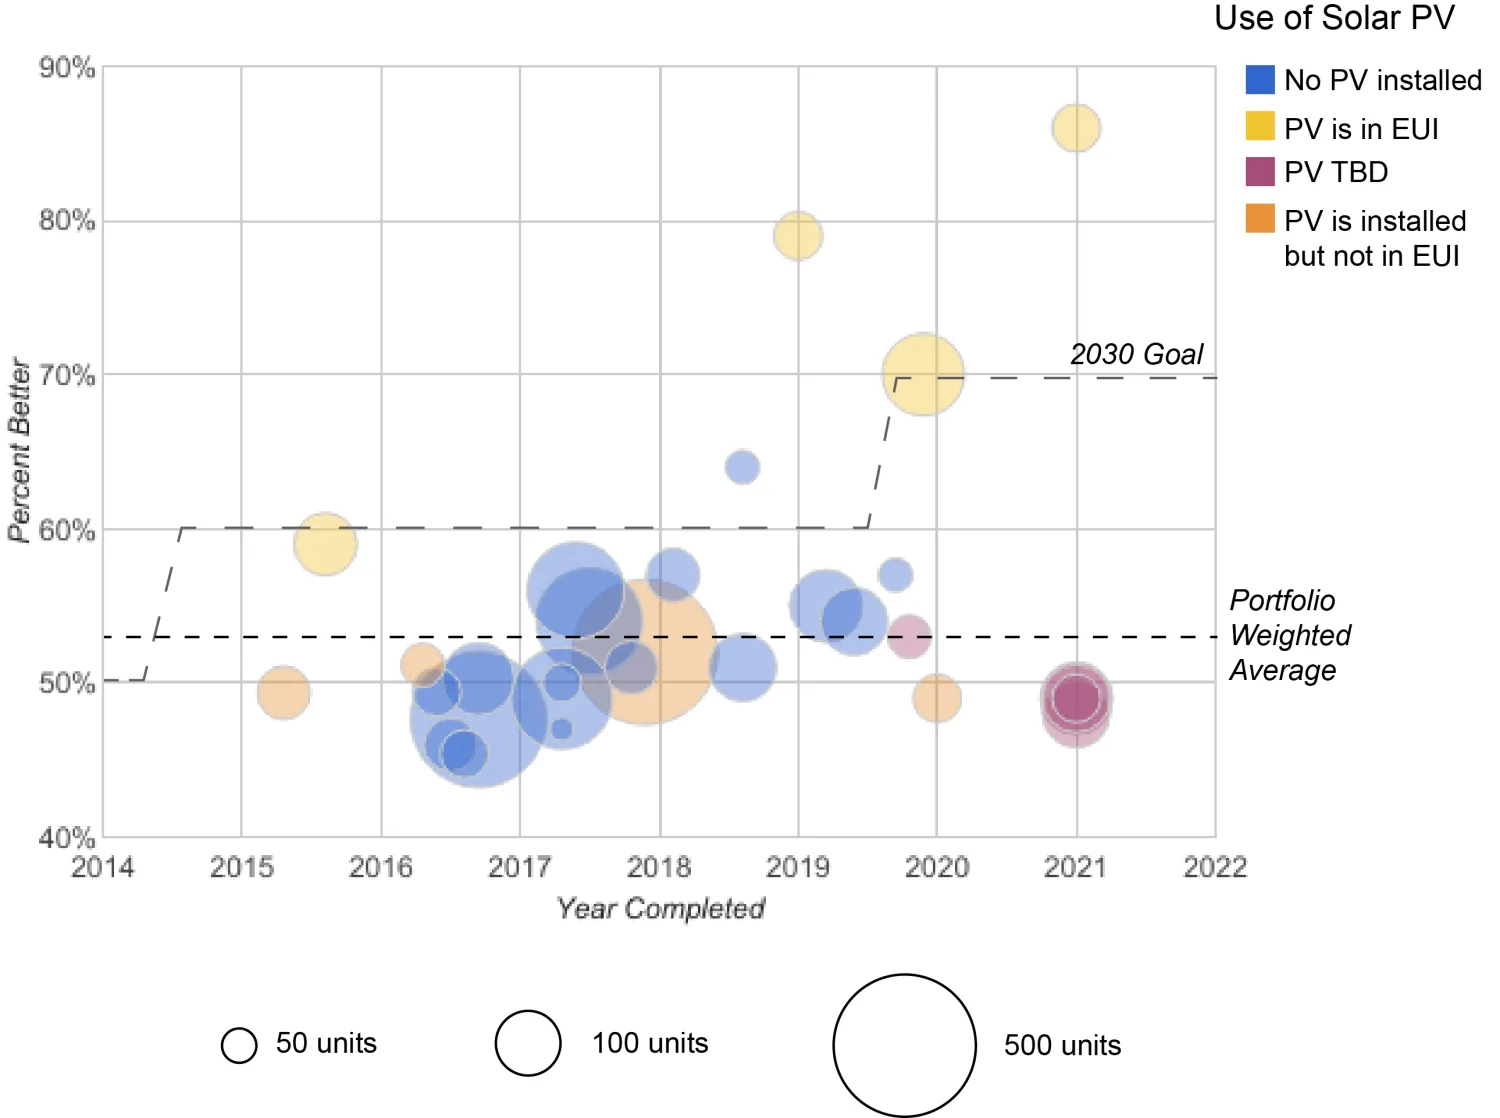
For buildings in the pipeline between 2015 and 2020, the target EUI reduction is 70%. Here are our results by building, hot off the presses, for the 2016 reporting year (Figure 1). We have differentiated projects by size as well as by the presence of solar photovoltaics (PV).

Q: Wait...so performance is a percent reduction. What baseline are we using?
A: Great question. It seems to be a bit of a moving target for multifamily buildings. Officially, the 2030 Commitment—which I’ll call 2030 for short—designates multifamily buildings by categories established in the Department of Energy’s Residential Energy Consumption Survey (RECS) database, and buildings “of 5+ units”—including everything from attached townhomes to high-rise condos—yield a national average EUI of 50. Other than being an average of buildings that have little in common, this baseline is particularly problematic in that RECS data accounts for energy use associated with in-unit (household) residential square footage only. It would be unusual for a design team to create an energy model to predict the energy use of only the residential areas of a building. Besides, common areas can make up a disproportionately large share of an apartment building’s energy usage.
In recent years, 2030 has tried to establish consistent baselines across all reporting firms and building types by encouraging firms to use ENERGY STAR’s Target Finder Tool, which identifies the national median EUI for a building type from a large database. This database, which was not available for multifamily buildings until somewhat recently, normalizes multifamily buildings according to various parameters, and results in a baseline EUI of closer to 32-40 for our mid-rise apartment buildings. For comparison, if you look at the national median across all multifamily buildings in this database—the counterpart, you might say, to the RECS national average which combines buildings of different sizes, occupancy types and unit densities—it grows to a whopping 78.8 kbtu/sf-yr. (This is thanks, I suppose, to all the high-rise condos in New York and Chicago.) We are still exploring Target Finder, but baselines seem most sensitive to changes in building height (number of stories).
To make matters just a bit more interesting, a few months ago, the 2030 Challenge (the global effort behind the AIA 2030 Commitment) migrated much of the Target Finder data into an independent tool called Zero Tool, so that the historic 2003 benchmarking data could be fixed in time for 2030 signatories (and not get “disappeared” by the current administration). Curiously, in testing it out this year, I found a significant difference between the baselines generated by Zero Tool and Target Finder.
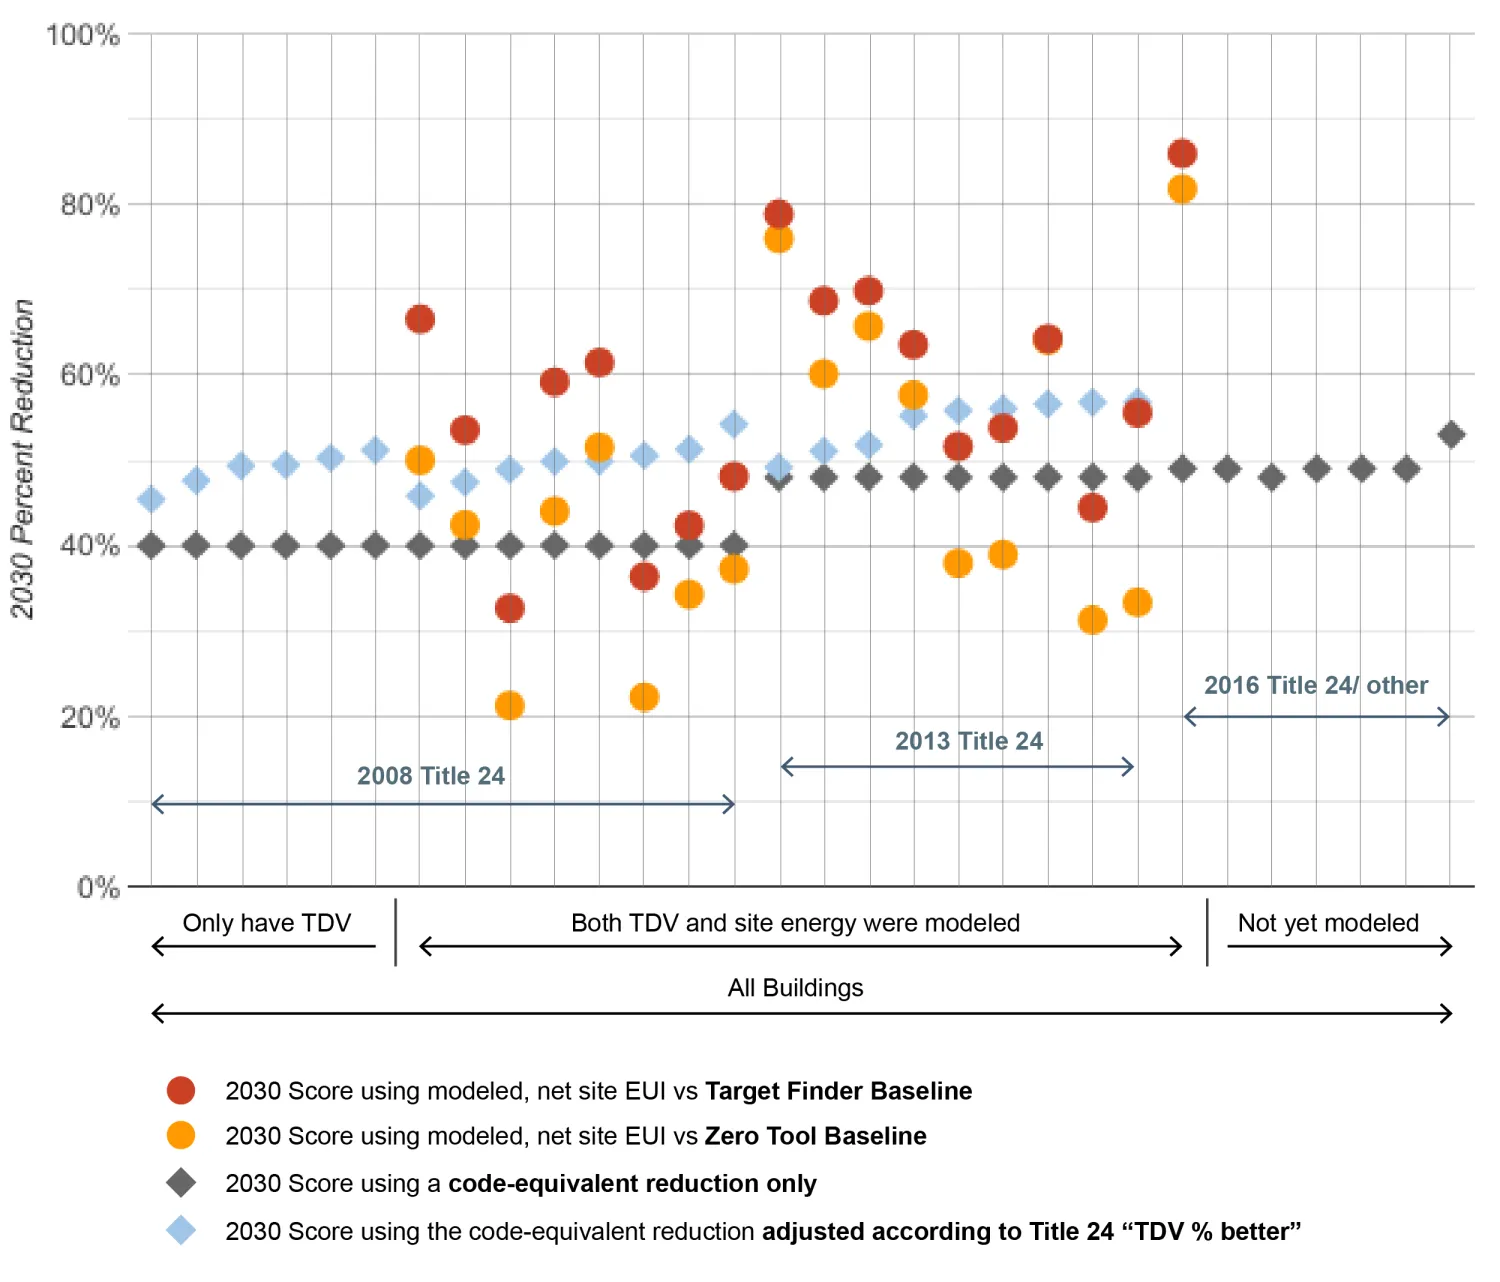
You can see below (Figure 2) how differences in the baseline used and our method of calculation impact the 2030 percent reduction score for each building, spanning 30 percentage points in many cases. All of these would be defensible reporting methods. The next section goes into more detail explaining the variation.

2030 Resources are surprisingly unclear when it comes to defining the most appropriate way to set a common benchmark. When reporting in the online “DDX” tool, you have the option of selecting a baseline defined by Target Finder (again, a national, “weather-normalized” median for buildings with similar characteristics), or selecting a “regional baseline” which is the national RECS average for the entire building type (although it’s confusing, because 2030 is a global program, “regional” in this case refers to our region, the entire United States. I think.). As a third option, you can also elect to define your own baseline.
So far we have discussed three issues: “national vs regional,” “median vs average,” and “normalization by like parameters vs lumping all buildings together.” A fourth confusion is weather-normalization vs climate normalization.
Weather-normalization is a way to correct a set of recorded energy data for deviations from what is “typical weather” for an area. This is not the same as climate normalization, which would be a way of “regionalizing” the data (if you want to compare yourself to other buildings subject to similar heating and cooling needs). Although based on Target Finder, Zero Tool explains its data is “climate normalized,” which could either be an editorial mistake, or the reason why those baselines are consistently lower for our Bay Area buildings than those generated directly from Target Finder (compare red and orange dots in Figure 2).
Aside from being accurate and consistent with other signatories, how you determine your baseline can have a major impact on how you use 2030 reporting to inform your practice. On the one hand, it may be most helpful for an architect to know how a building is faring compared to “what’s normal” for the context—e.g. you don’t want to take credit for achieving a very low EUI if you are not a 30-story condo in Chicago. On the other hand, if you are meeting a worldwide reduction target, you want to start from the same place as everyone else—otherwise, in San Francisco, you are probably reaching much deeper, with diminishing returns on carbon impact—in order to achieve the same percent reduction as you would for a similar project in New York.


Q: Waaait. These results are all over the place! What are we using to model our buildings? Does the model assume the same parameters as the baseline data?
A: No it doesn’t. If you thought the baseline question was confusing, this is actually the main sticking point for our firm.
Finding the EUI numerator—annual kbtu:
Over the last decade, since California set out to ambitiously push the state toward zero energy buildings by 2030, most certification and incentive programs such as GreenPoint Rated, LEED for Homes, and Tax Credit Allocation Committee (TCAC) Awards, have accepted basic percent improvement under state code to demonstrate responsible energy design. As a result, the energy model used for code compliance has become the dominant tool for energy analysis during design (for us), which means it carries implicit but significant influence over energy decisions.
If you are familiar with energy modeling, it is probably not news to you that using a compliance model as a feedback tool during design is problematic. But the reality is that when codes are ambitious, design teams have little incentive to look past these requirements. This is especially true for residential projects, primarily because it is rare for one of our clients to ask us to do something fancy, like analyze comfort or operating costs, measure the impact of innovative strategies, or explore zero-energy feasibility—all reasons one might build an energy model more appropriate for design feedback and benchmarking.
Therefore, the vast majority of our projects rely on California Title 24 code compliance modeling for reporting. In addition to certain model assumptions being inaccurate or incomplete, many of our Title 24 reports (until recently) also failed to include the predicted site electricity (kWh) and natural gas (therms) use. After all, Title 24 performance is not based on physical units of energy, but on a special metric called Time Dependant Valuation (TDV) of energy, which assigns multipliers to the electricity and gas use to adjust for the economic value of using certain fuels at certain times.
Scrutinizing the denominator: gross square footage:
Since “area” is in the denominator of the EUI metric, how you choose to include and exclude areas consistent with the baseline data has a major impact on your final number! Mid-rise, mixed-use residential buildings can vary significantly by the amount of non-residential use and the percentage of common area that is considered unoccupied or unconditioned, which can throw off benchmarking comparisons. Surprise, surprise: Title 24 accounts for areas slightly differently than ENERGY STAR, and it can be time consuming to reconcile areas included by a certain Title 24 modeler with what should ideally be included in the EUI calculation. Our data is not cleaned for these discrepancies, and one thing we are doing to address this in the future is to create protocols for sharing documents with our energy consultants to make sure our calculations are at least consistent and transparent project-to-project.
Just to throw in another wrinkle, for residential buildings specifically, energy-using equipment and internal loads arguably have a closer relationship to the size of dwelling units or the number of bedrooms in a project, rather than by gross square footage, making the very metric of EUI potentially less appropriate for multifamily than for other building types. Target Finder incorporates the number of bedrooms, so to some extent it solves for some of this variation. In general, we’re going to ignore this debate for now, because it’s one too many things to worry about.
How we report:
In short, although things are improving, the nature of multifamily buildings, Title 24 compliance modeling, and other aspects of our workflow have made it virtually impossible for us to report accurately. The results you saw in Figure 1 are the result of one of two methods:
- In fact, for some projects, we do have the site energy use information from the TItle 24 report, or another source, and we have some reason to think it looks about right. This is true of many projects we’ve done under the 2013 code.
- For projects under the 2008 code, or for which we have a reason to question the results, we can at least claim credit for meeting the code. The AIA 2030 team publishes “equivalent percent reduction” values for common energy codes. For instance, if you have a building in concept phase that hasn’t been modeled yet, but you know it’s going to be permitted under the 2016 version of Title 24, you can automatically claim a 49% reduction toward the 2030 target, based on some very broad-brush assumptions that are not specific to building type.
For buildings in our portfolio that have been modeled under a given code, we have elected to assign an additional boost in their overall percent reduction according to the “TDV percent better” they earned. The purpose of doing this is not actually to make us look better, but to get some degree of consistent feedback about the diversity of performance across our portfolio. But we hope to be able to phase out this method since it is as bogus as it is unsatisfying. One notable drawback is that we can not take into account any PV.
Q: Well, gee, this all sounds like a total waste of time. Why are we doing this?
A: Like many incentive frameworks within the green building industry, and life in general probably, often the thing you think you’re striving toward is not actually where your investment is yielding its true returns. Like LEED, which is not, in fact, a way to identify individual “sustainable buildings” but rather a program to transform an entire market over time, the 2030 Challenge can be seen as a similar sleight-of-hand, tricking architects into racing to the top while quietly forcing us to transform the way we think about and integrate building performance into our practice.
Here are some of the ways devoting resources to the 2030 Commitment has transformed the way we work:
- Project comparison. We have already learned a lot about our buildings that we hadn’t seen before, just by placing them side-by-side. Even though the numbers generated might be garbage in real life, the discipline of employing a method of data collection consistently across an entire portfolio hones your frame of reference for what is “typical,” what is an outlier, and what design features (or team leaders and consultants) tend to correlate with higher-quality information and results.
- Better documentation. Coordinating with our energy consultants to ensure we collect consistent, quality documentation about performance for each project has become a high priority, enhancing feedback of lessons learned project-to-project. Since the early days of LEED, our consultant relationships and workflow have become so automatic that we haven’t always done a good job compiling the key documents from which we could learn the most.
- Design energy modeling. We now advocate for design energy modeling scope in addition to compliance modeling as a matter of course, and we are becoming better able to demonstrate to clients why this is important and can lead to decisions that actually make economic sense for the owner.
- Data collection. We have renewed motivation to collect actual whole-building energy data. There is nothing like the real numbers, and we have been building partnerships with clients who might be willing to collect and share this data with us, so we can start discovering what’s actually going on. (If you’re one of these people, get in touch with me!)
Thank you for joining us on this complicated journey of discovery. In a world in which the bragging rights of hitting performance metrics are increasingly valuable, our industry has a bit of a tendency to gloss over wrinkles that have not been ironed out. In the case of multifamily buildings, this attitude would do us a real disservice as designers.
There is a lot we don’t know about the performance of mid-rise multifamily buildings due to their tendency to elude classification, the nature of the market, and the fact that available frameworks and metrics have been cobbled together from commercial and residential building types.
Is this a necessary inconvenience? Or are can we start to use this building type as a stress-test for the evolving ways we define performance and sustainability? After all, in many ways mid-rise residential buildings are at the heart of sustainable urban development.